
I often marvel when something happens that’s out of the ordinary. Being treated to blooms of bioluminescent algae which turn the ocean into a dazzling neon light show is otherworldly.
Marine bioluminescence is a chemical reaction manifesting in the form of light that occurs when single-celled organisms called dinoflagellates are disturbed by a wave or splash.
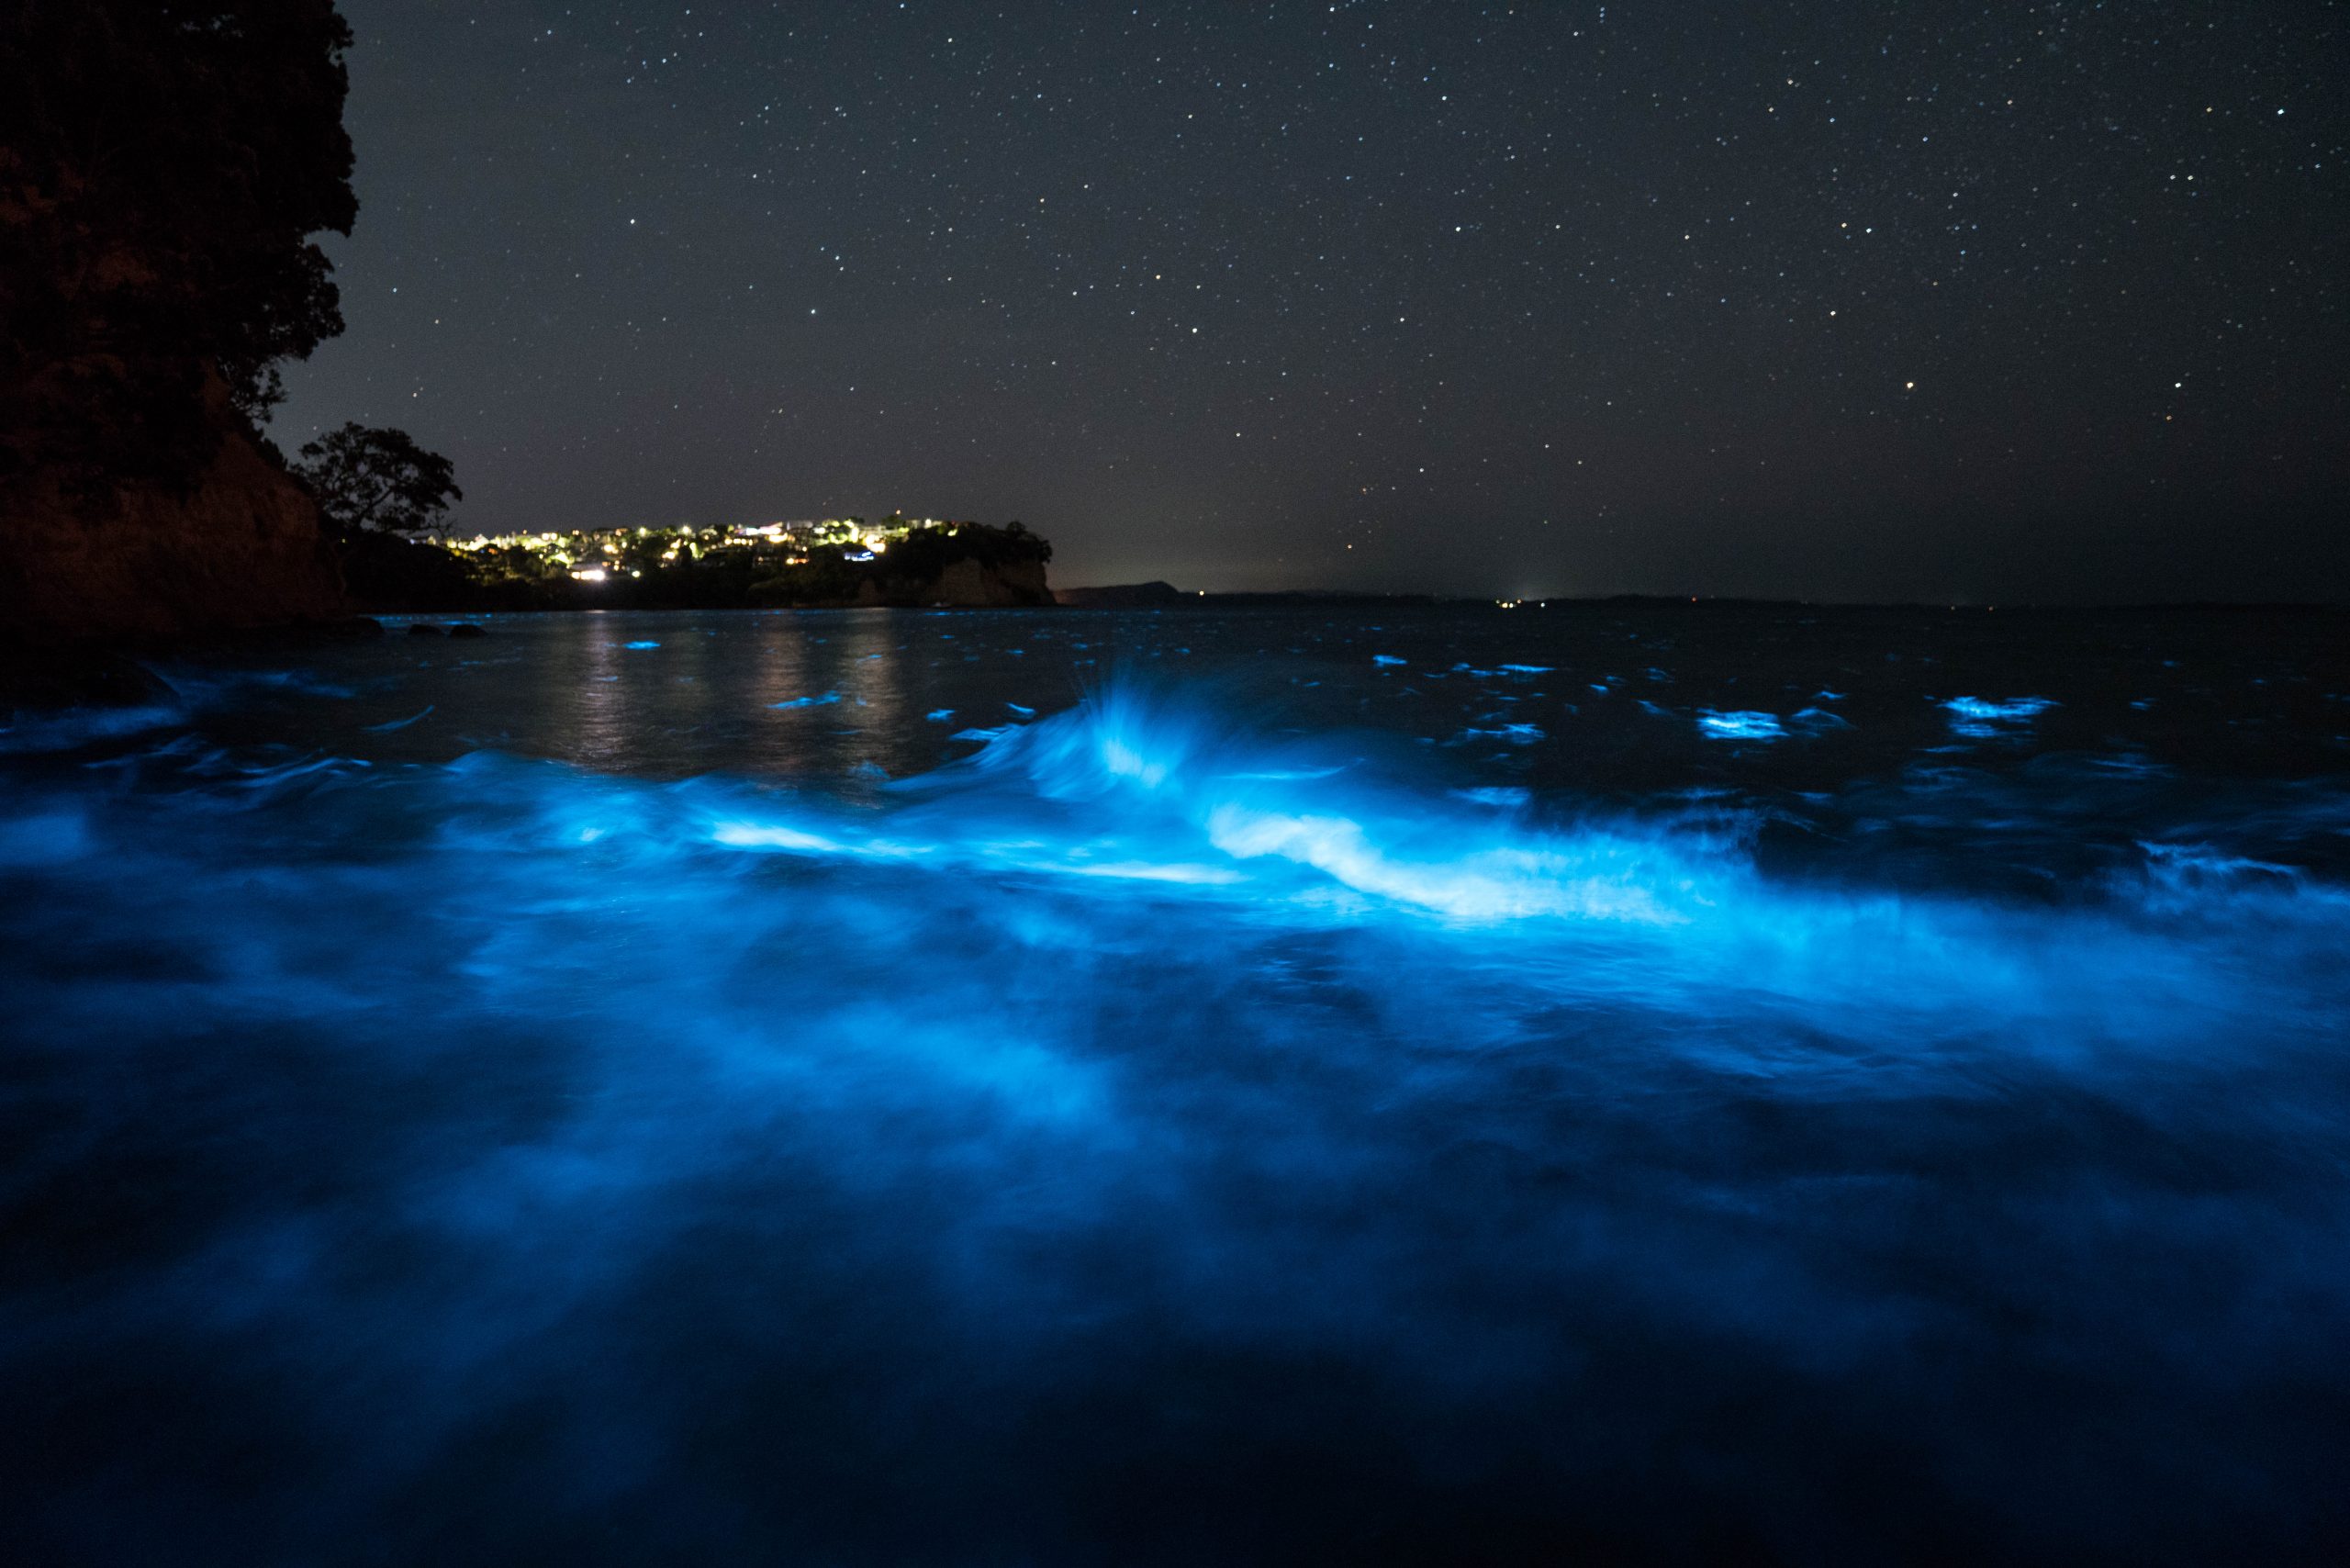
Whilst remarkable, the phenomenon is notoriously difficult to catch sight of. Success often comes down to blind luck – being in the right place, at the right time. But the chances have dramatically improved.
There is a small army of “bio hunters” who religiously search the shores around the Hibiscus Coast (New Zealand) and beyond. When the blue gold is found, a flurry of social media alerts follow. It’s a great people-powered system that enables many to witness this wondrous spectacle.
But could science and technology help uncover this elusive algae even further and ultimately produce a working bioluminicense forecast? This is something I’m working to answer.
The first phase of this project has been to determine if the algal blooms responsible for the bioluminescence (often Noctiluca scintillans) can be identified using super high resolution satellite imagery and multi-spectral sensor (MSS) bands.
Before I get into the details of my findings, I wanted to caveat that I am not trying to forecast when algal blooms (that produce bioluminescence) may form. This project’s objective is to identify, track and measure these blooms once they’ve formed with the hope of improving sightings. Data is sourced from Sentinel-2 L2A (to 10m, 20m, and 60m, depending on the wavelength) and MODIS (as a secondary source) due to its high revisit time (but limited due to its minimum spatial resolution of 250m). Landsat 8-9 can also be utilised, with its spatial resolution of 15 m but has a lengthy revisit time of 16 days.

The short answer is yes, medium-large concentration blooms can be easily identified.
On January 20, 2020 a significant red algal bloom was observed just north of Rangitoto Island (Auckland, New Zealand). In the days after, significant bioluminescent activity was reported.

Credit: J Curnow
Super high resolution satellite images (True Colour, taken on 2020-01-20) identify this algal bloom and is visible in three areas with the most distinctive to the north of Rangitoto (where the above image was taken).
Using this as a positive baseline, I applied a number of MSS bands into an index equation, with varying thresholds to best amplify the algal bloom imagery and reduce noise (from features not of interest, including limited cloud cover).
Fig 1: Typical “noisy” image: Fig 2 & 3: Isolated/enhanced images showing algal bloom:


Note: The visible channel lines are the result of boats sailing through and dispersing the algae.
Possible blooms are also visible when applying this same methodology across other periods with sightings of bioluminescence:
Example #1 > Incredible sight as bioluminescence lights up Napier’s water in electric blue | Source: Newshub
Date of sighting: 2018-08-23
Visible algal bloom, Napier (taken on 2018-08-24)

Example #2 > Bioluminescent plankton brings blue glow to Auckland | Source: Stuff.co.nz
Date of sighting: 2020-01-24
Visible algal bloom, Whangaparoa Peninsula (taken on 2020-01-24)

Example #3 > Photographer captures ‘best naked eye’ bioluminescent display he’s seen on beach north of Auckland | Source: 1 NEWS | TVNZ
Date of sighting: 2021-01-05
Visible algal bloom, Whangaparoa Peninsula (taken on 2021-01-04)

The same parameters used to identify the algal bloom (dated 2020-01-20) show similar classification in all three examples of positive bioluminicense sightings.
Whilst there is still much work and analysis to be done, I can now (manually) provide advance warning of medium-to-large concentration algae blooms around Auckland. Through manual analysis of ocean and weather models, I may be able to provide basic track paths.
In the second phase, I hope to automate the identification process and dramatically scale the area of analysis NZ wide. The plan is to develop and train a machine-learning model to enable this.
In the third phase, I hope to integrate both ocean and weather models to understand algal bloom movements and track paths.
Phase One: Methodology (using Sentinel, MODIS and Landsat satellite data, multi-spectral sensor (MSS)) for the identification and measurement of newly-formed red algal blooms.
Phase Two: (Current Stage) Application of Machine Learning to scale identification. UPDATE: (April 2024) We are in the process of training an AI model to look for and identify algal blooms within the satellite data. We’re hoping this will lead to our first automated alert system.
Phase Three: Integration of ocean and weather models and other parameters (to facilitate tracking).

Limitations & Caveats
This methodology does not pinpoint algal blooms with complete certainty every time. Further testing and validation is required.
The quality and the regularity of the satellite data is mixed. For the month of December 2020, Sentinel-2 L2A had a general revisit time of 4.4 days. Approximately one third of those images are not suitable for analysis (primarily due to excessive cloud cover). I am actively reviewing other sources including MODIS and Landsat.
All information in this site is provided as is, with no guarantee of completeness, accuracy, timeliness or of the results obtained from the use of this analysis.
When the next concentrated bloom heads our way (limited to an area including and around Auckland), I hope to spot it and provide some advance warning and enable more people to witness the blue gold.
Comments (2):
Lani
Keep me posted
John
When the algae dies in masses are the fish amongst the algae in danger of death due to lack of oxygen?