

Last updated: July 2026.
I often marvel when something happens that’s out of the ordinary. Being treated to blooms of bioluminescent algae which turn the ocean into a dazzling neon light show is otherworldly.
Marine bioluminescence is a chemical reaction manifesting in the form of light that occurs when single-celled organisms called dinoflagellates are disturbed by a wave or splash.
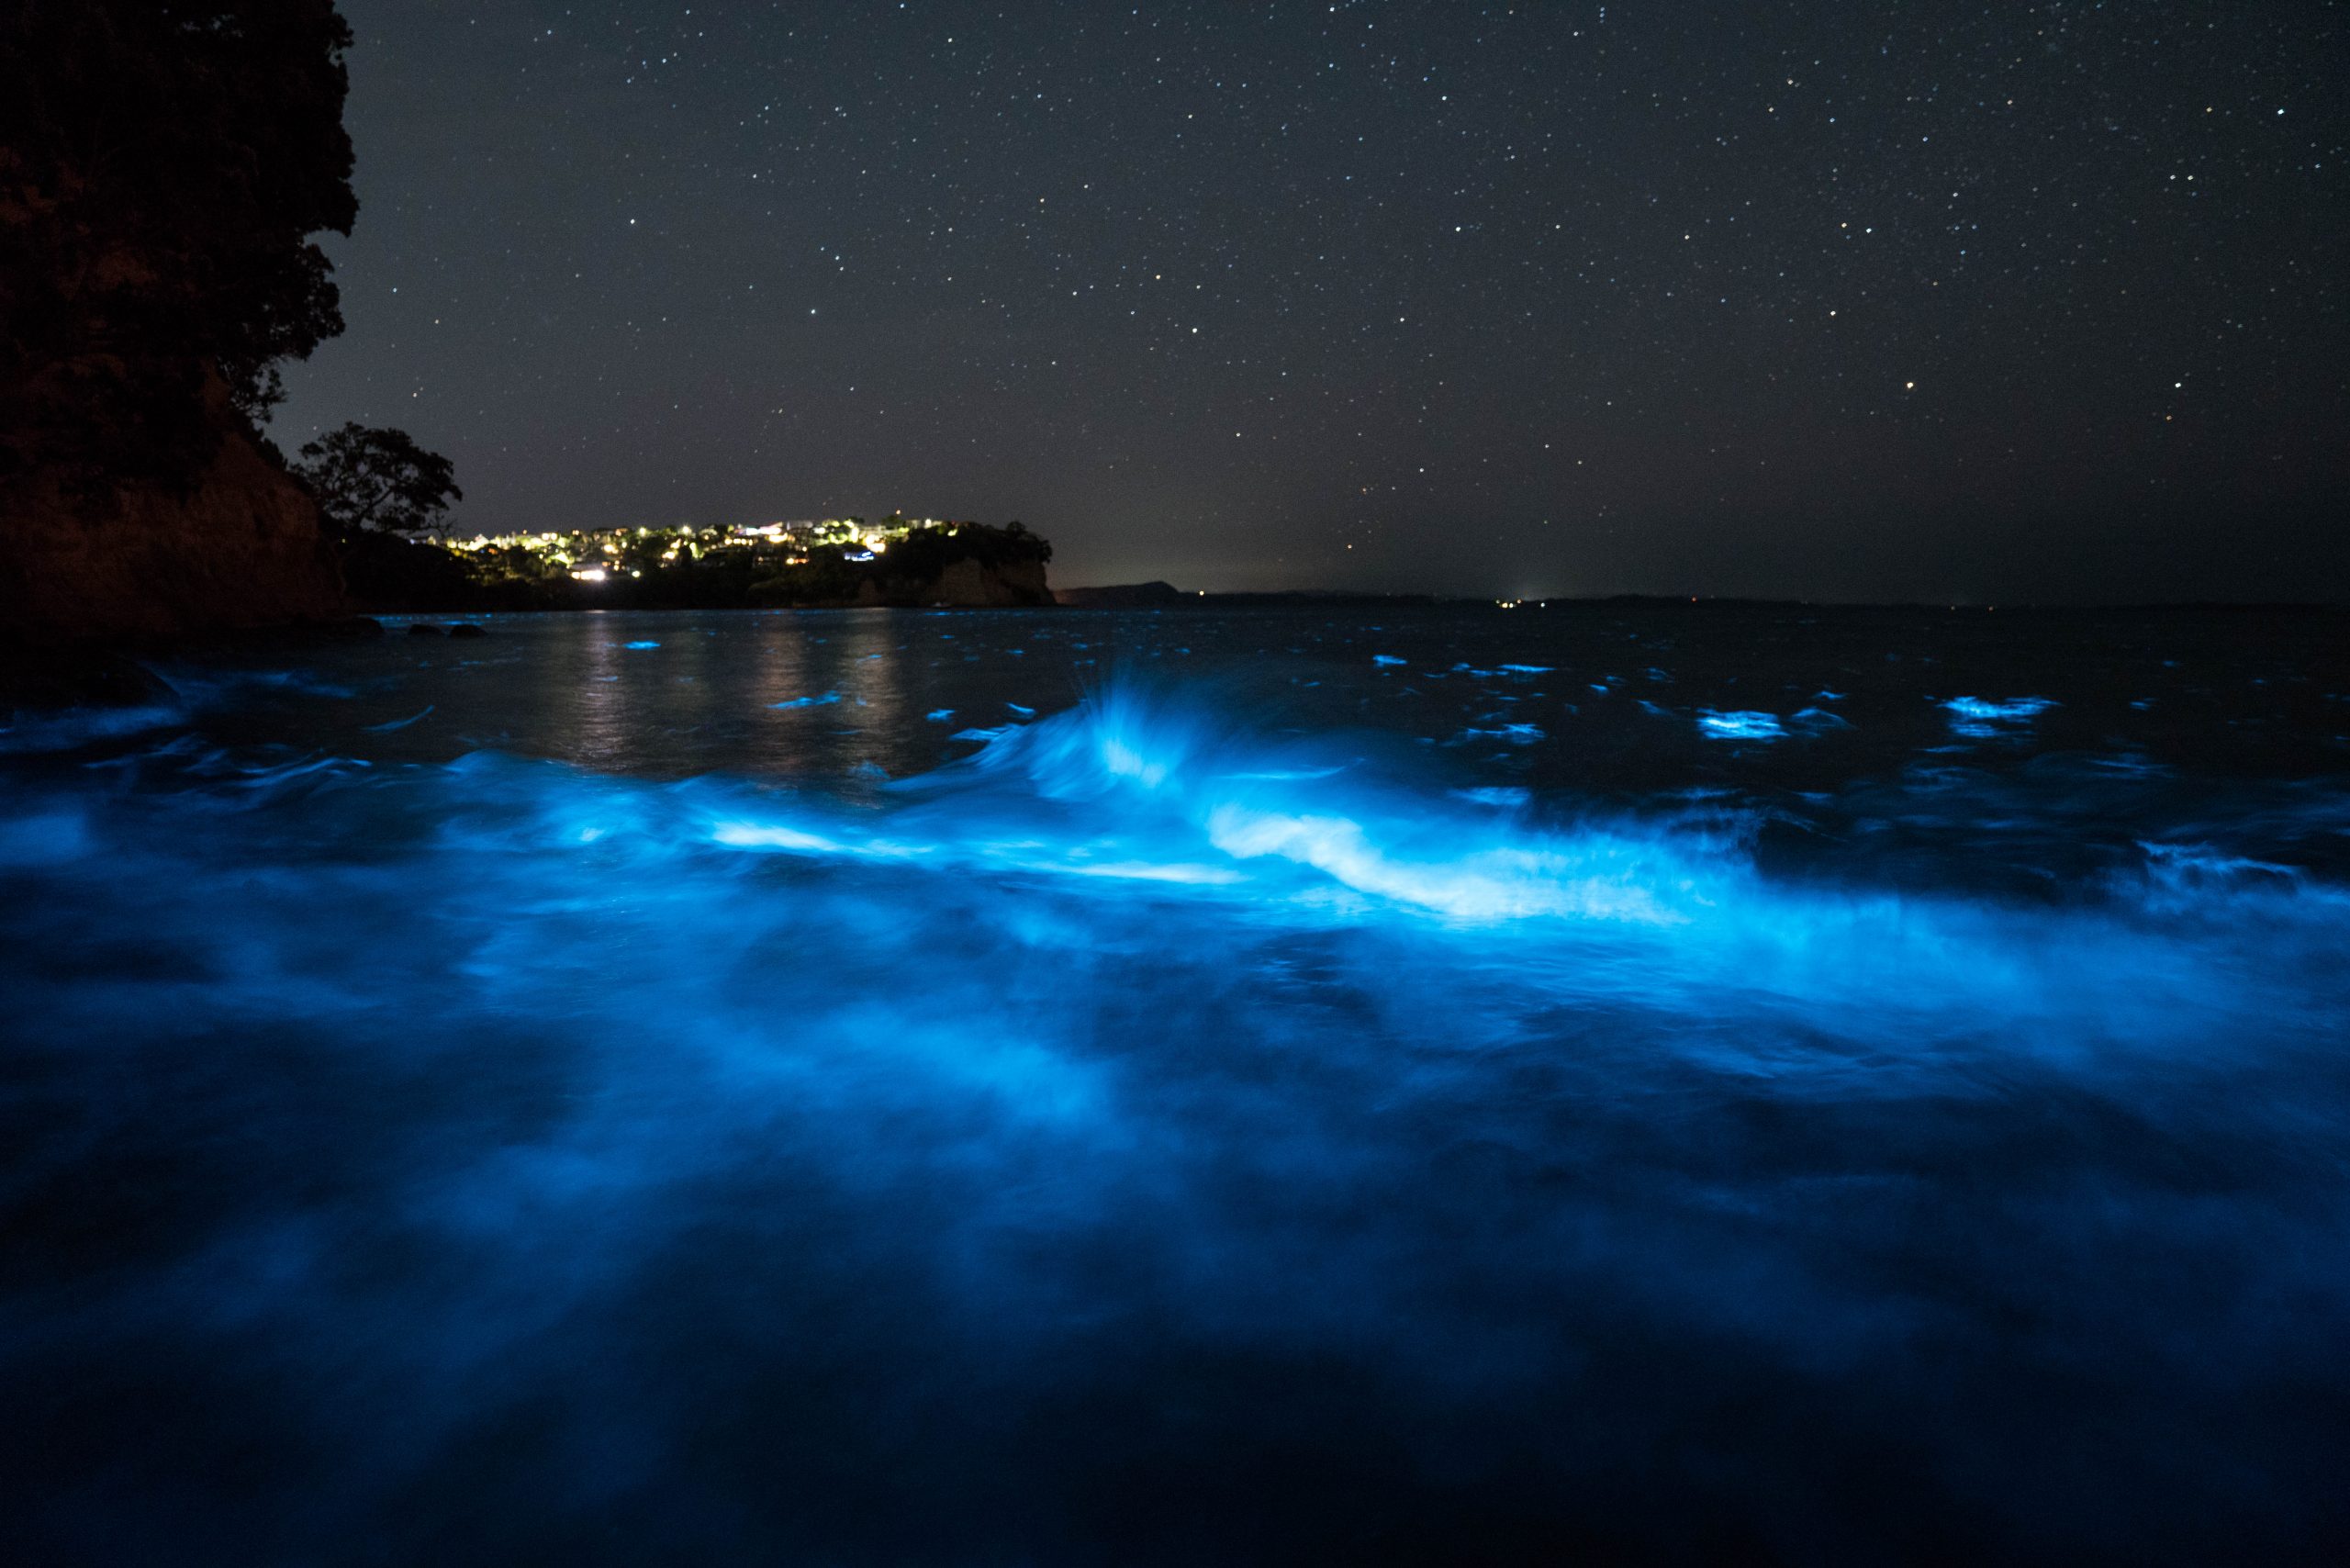
Whilst remarkable, the phenomenon is notoriously difficult to catch sight of. Success often comes down to blind luck – being in the right place, at the right time. But the chances have dramatically improved.
There is a small army of “bio hunters” who religiously search the shores around Auckland, New Zealand (my home) and beyond. When the blue gold is found, a flurry of social media alerts follow. It’s a great people-powered system that enables many to witness this wondrous spectacle.
But could science and technology help uncover this elusive algae even further and ultimately produce a working bioluminicense forecast? This is something I’ve taken a crack at.
Where this started: can satellites s
My first attempt looked purely at satellite imagery – Sentinel-2, MODIS, Landsat and checking whether a bloom’s chlorophyll signature was visible from space before anyone on the beach knew it was there. It worked, in a narrow sense: medium-to-large blooms genuinely do show up in the right spectral bands, and I found several real matches between satellite passes and reported sightings going back to 2018. But it was never going to be enough on its own. Cloud cover ruins a third of every image. A satellite pass tells you the organism is somewhere in the water, not whether tonight is dark enough, calm enough, or the right tide to actually see
Fig 1: Typical “noisy” image: Fig 2 & 3: Isolated/enhanced images showing algal bloom:


Note: The visible channel lines are the result of boats sailing through and dispersing the algae.
That satellite work was always “Phase One” of a bigger plan. Phase Two, on the roadmap since the beginning, was to fold in real ocean and weather models alongside it. That’s what I’ve actually built now, and it’s turned into something I use myself most nights: Biocas
Biocast scores these separately rather than blending them into one misleading numbe
Bloom likelihood blends phytoplankton and chlorophyll-a satellite readings (the direct descendant of my original Phase One work) with sea-temperature anomaly. Not just “is it warm,” but “is it warmer than normal for this exact beach in this exact month”, plus dissolved oxygen, nitrate levels, pH, season, recent rainfall (blooms build 3–5 days after a big rain event washes nutrients in, not immediately), and whether the last few days have been calm enough for a bloom to survive rather than get physically dispersed by wind a
Viewing conditions is the practical half: how dark it actually is once you account for the moon (a bright full moon can wash out a glow that a thick cloud cover would have hidden nicely), whether there’s enough wind-driven chop to trigger the flash without needing to wade in and disturb it yourself, and how close the evening is to high tide. Bioluminescence is reliably easier to spot within a couple of hours either side of
Complete list:
- Recent confirmed sightings. The single biggest factor. A real sighting reported at a beach (or nearby) in the last few nights is stronger evidence than any weather data alone.
- Satellite imagery. We check Sentinel-2 and Landsat 8/9 imagery for signs of active blooms nearby.
- Phytoplankton. More phytoplankton means more food available for Noctiluca, so we track daily phytoplankton levels from ocean forecast data alongside chlorophyll.
- Ocean chlorophyll. Noctiluca needs the right water to thrive in, so we track chlorophyll concentration at each beach.
- Nitrate levels. Nitrate is a key nutrient that feeds the plankton Noctiluca relies on, so we track how much is in the water.
- Dissolved oxygen. Oxygen levels reflect how much biological activity is happening in the water, another clue to how favourable conditions are for a bloom.
- Ocean pH. Changes in pH reflect broader shifts in ocean chemistry, so we track it alongside everything else that shapes bloom conditions.
- Sea surface temperature and anomalies. How far the water temperature sits from the seasonal norm for that beach and time of year.
- Wind speed and direction. Onshore wind helps push bloom-carrying water toward the beach; the wrong direction or too strong a wind works against you.
- Tides. Glow tends to show up more reliably around certain points in the tidal cycle, so we check how close your evening is to high tide.
- Wave and swell, wind chop. The water needs some disturbance for the glow to show, a wave breaking, water moving; too calm and there’s nothing to trigger it, too rough and it washes out.
- Rainfall and runoff. Both today’s rainfall and the runoff that follows over the next few days can shift conditions, though this plays a smaller role in the model since the science here is less settled.
- Moon and cloud cover. Bioluminescence is easiest to see against a dark background. A bright moon with no cloud cover washes it out; cloud cover in front of a bright moon helps you see it.
Splitting the problem into two honest questi
The breakthrough, for me, was realising “will I see bioluminescence tonight” is actually two separate questions that get conflated constantly:
- Is anything actually blooming right now? A slow-moving, low-confidence question. Nobody can say for certain; the best you can do is read the signs.
- If it is, will tonight actually show it to me? A completely different, high-confidence question about moonlight, wind, wave action, and tide, all of which are forecastable days in advance.
Biocast.nz scores each of these.
Bloom likelihood blends satellite imagery (the direct descendant of my original Phase One work – where available), chlorophyll-a readings with sea-temperature and anomalies, plus season, recent rainfall (blooms can build 3–5 days after a big rain event washes nutrients in, not immediately), and whether the last few days have been calm enough for a bloom to survive rather than get physically dispersed by wind a

Viewing conditions is the practical half: how dark it actually is once you account for the moon (a bright full moon can wash out a glow that a thick cloud cover would have hidden nicely), whether there’s enough wind-driven chop to trigger the flash without needing to wade in and disturb it yourself, and how close the evening is to high tide. Bioluminescence is reliably easier to spot within a couple of hours either side of
Turning “bio hunters” into a l
Satellite passes and weather models only get you so far. The single strongest signal Biocast has (and by a wide margin) is a real person standing on the sand right now saying “yes, I can see it.” So the site now has an actual live map, with a “Report sighting” button on ev
Crucially, it separates two very different claims a report can
- Glowing water at night. A direct, first-hand confirmation of the actual bioluminescent flash. This is about as close to certainty as the model ever gets.
- A daylight algal bloom. Seeing the telltale pink/orange discoloration in the water during the day, before it’s dark enough to know if it’ll actually glow tonight.
The report form also captures additional detail: the extent of the bloom, and whether it’s sitting along the beach edge or further offshore.

Pink/orange discoloration in the water. Credit: J Curnow
A report from a beach a few kilometres down the same stretch of coast nudges nearby beaches’ scores too, with the effect fading out by distance. A sighting at Big Manly Beach for example, tells you something real about Tindalls Beach next door
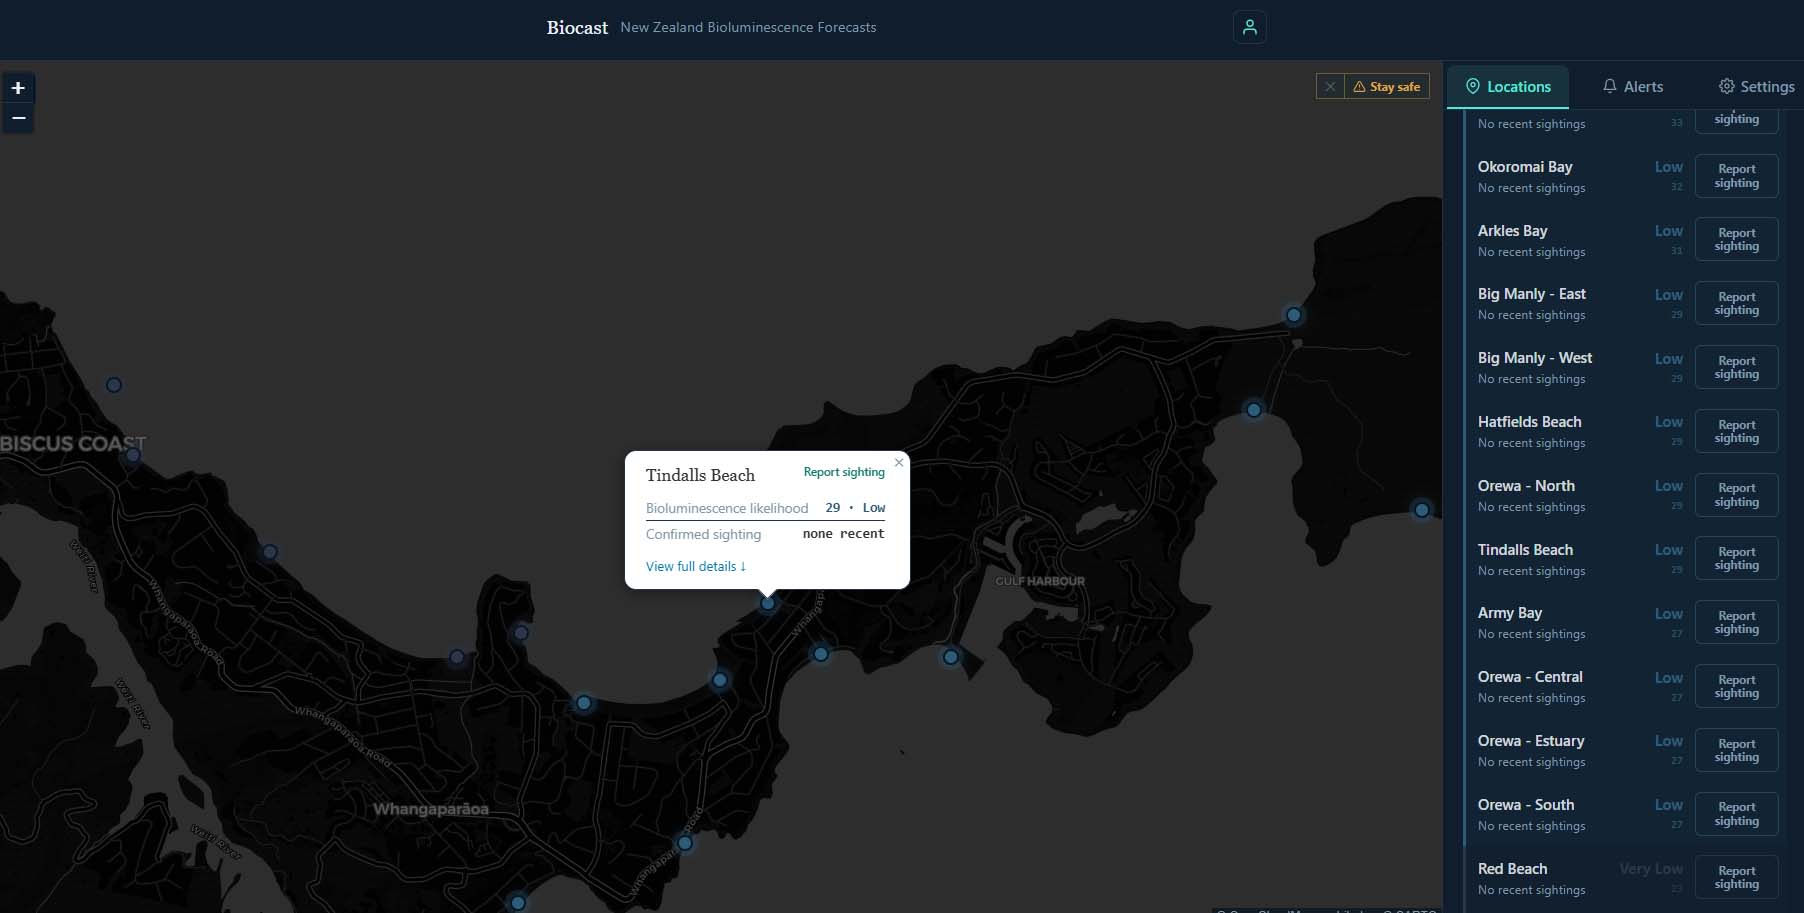
If you want to be told the moment any of this happens, there are email and push notification alerts you can tune to whichever confidence tier you actually care about.
The real long game: building a
Every sighting gets pinned to a time and place, then matched against the conditions that night. The chlorophyll, the sea temp, the wind, the rain, all of it. Nights with no sighting count too. Slowly that builds a dataset – whats going on, and whether it glowed. Once there’s enough of it, that becomes the training data for a machine learning model that can find the patterns.
Give it a season or two of real reports rolling in from an actual community of people checking the coastline, and I finally have honest-to-goodness ground truth to check those guesses against and adjust the ones
That’s when it gets interesting. A model trained on that record could work out which of the variables genuinely matter and which are just along for the ride. It could find the thresholds for the factors we *think* matter. For example, the point where nutrient runoff stops mattering and starts mattering a lot. It could pick up combinations no one thought to look for, because blooms probably need several things at once rather than any one thing. And it could tell us how far in advance a bloom is actually predictable, which right now is anyone’s guess.
Try it
Biocast is live now, covering the Hibiscus Coast of New Zealand and a few more up and down the coast. If you’re anywhere near the Hibiscus Coast and you’ve ever
Comments (2):
Lani
Keep me posted
John
When the algae dies in masses are the fish amongst the algae in danger of death due to lack of oxygen?